On Campus Programs
MasterclassFree ResourcesAlumni
logo

Online Programs

Digital Marketing
Data Science & Analytics
New
AI Programs
New
Full Stack with AI Engineering
Cyber Security
New

On-Campus Programs

Jaipur
Jodhpur
ai-powered

Data Analytics Course in Jodhpur (Master Data Analysis)

Data Analytics Course in Jodhpur (Master Data Analysis)

Join the best Data Analytics course in Jodhpur and master real-world analytics tools, work on live projects, and prepare for top data roles - all in just 16 weeks.

  • job-guarantee-icon
    4.9/5
    1,032
    Reviews
  • job-guarantee-icon
    3.8K+
    Aspirants
    Mentored
  • job-guarantee-icon
    7+
    Industry
    Mentors
AI-Infused Project-Driven Curriculum
Curriculum

AI-Infused Project-Driven Curriculum

Master how AI enhances data cleaning, visualization, and predictive modeling in modern analytics.

  • Industry projects on finance, e-commerce, martech
  • Strong portfolio of dashboards, reports, and models
  • Master AI tools that automate repetitive analysis tasks
Guided by Data Experts from Top Companies
Mentorship

Guided by Data Experts from Top Companies

Learn directly from data leaders from Google, Amazon, Microsoft, Rapido & KPMG.

  • Master real data workflows with insider insights
  • Learn applied analytics with hands-on problem-solving
  • Get guided feedback on every milestone and project
Mega Capstone Data Challenge
Learn By Doing

Mega Capstone Data Challenge

Experience the intensity of solving a real business problem end-to-end from raw data to insight-driven storytelling.

  • Work in teams on large-scale data problems
  • Present insights to industry mentors
  • Compete for top performer recognition
Job-Ready with WsCube Placements Support
Placements

Job-Ready with WsCube Placements Support

Get dedicated help throughout your hiring journey end-to-end with real recruiter expectations.

  • Guided preparation for every stage of placements
  • Learn how to crack analytics jobs & interviews
  • Referrals to 350+ partner companies
AI-Infused Project-Driven Curriculum
Upgrade Your data Analytics Career with AI
AI Agents, Automation & Workflow

AI Agents, Automation & Workflow

  • ●Automate repetitive data tasks using AI-powered tools like n8n and Make.com.
  • ●Design smart workflows that think, decide, and execute through AI agents.
  • ●Build complex automations effortlessly with low-code platforms.
  • ●Turn raw data into real-time insights using automated dashboards and reports.

From Jodhpur Classrooms to Analytics Careers

Our alumni are working as Data Analysts, Business Analysts, MIS Executives, and BI Professionals across leading companies, startups, and growing organizations.

Under WsCube’s Mentorship
Transformed

Placement Report 2025-26

Get the complete report to explore all Jodhpur Data Analytics program outcomes.

90%

Median Hike

280+

Students Placed

₹18 LPA

Highest Package

Milestone 1 - Duration: 3 weeks

Kickstart your Data Analytics journey with Excel!  From pivot tables to essential functions and from charts to dashboards learn every essential to become a Data Analyst. Excel isn't just a tool, it's your new superpower!

Week 1

Introduction to Data Analytics & Excel - Ⅰ

  • Introduction to Data Analytics
  • Basic Features in Excel
  • Formatting in Excel
  • Dealing with Raw Data
  • Functions in Excel
  • AI Prompting for Excel formulas
  • AI-assisted data cleaning
Week 2

Deep Dive with Excel - ⅠⅠ

  • Data Connectors in Excel
  • Cleaning in Power Query Editor
  • Adding Conditional Columns using Power Query Editor
  • Data Modelling and its Importance
  • Cardinality and Filter Direction in Power Pivot
  • ChatGPT/Gemini → Generate Power
  • Query M scripts
Week 3

Master Advanced Excel - ⅠⅠⅠ

  • Pivot Tables in Excel
  • Charts in Excel
  • Slicers in Excel
  • Measures in Excel
  • Creating a Dashboard in Excel
  • AI Visual Recommendation
  • Dashboard Summary Insight
  • Narration with AI
  • Invideo/Descript using AI

Project:

Tata Power – EV Charging Network Expansion Analysis

As a Data Analyst at Tata Power, you have been tasked with using Excel to build a comprehensive EV Infrastructure Planning Dashboard. Analyze electric vehicle density, mobility patterns, charging demand, corridor coverage, installation costs, and revenue potential to identify underserved regions, estimate ROI per location, and recommend data-driven priorities for scalable charging network expansion.

Case Study

Icon
Analysis of Myntra Apparel

You are working at Myntra, a leading online fashion retailer. The management has asked you to analyse a dataset of various apparel items to gain insights into pricing, discounts, ratings, and available sizes.

Icon
Audible Data Cleaning

As a data cleaning analyst at Audible, you've been assigned the task of cleansing a dataset sourced from audible's app. Ensure meticulous attention to detail to guarantee the accuracy and reliability of our data for subsequent analyses.

Excel Interview Prep with Industry Expert

In this session, you'll master Excel for data analytics interviews. Learn insider tips on using Excel effectively, tackling real-world scenarios, and impressing interviewers with your data manipulation skills.

Milestone 2 - Duration: 3 weeks

Want to retrieve, clean, manipulate and analyse the data?? Do it efficiently by using SQL queries!! This milestone covers everything from basic queries to complex joins, empowering you to extract valuable insights from large datasets with ease.

Week 4

Welcome to MySQL

  • Introduction to MySQL
  • Basic MySQL Syntax
  • Clauses in MySQL
  • Operators in MySQL
  • Dealing with Null Values in MySQL
  • AI for SQL query generation
  • AI debugging SQL errors
  • AI auto-documentation of queries
Week 5

Advanced SQL Queries and Functions in MySQL

  • Functions in MySQL
  • Case Operator in MySQL
  • Group By in MySQL
  • Having Clause in MySQL
  • Joins in MySQL
  • Query Optimization using AI
Week 6

Advanced SQL Concepts and Techniques in MySQL

  • Subqueries in MySQL
  • Union, Intersect, Except in MySQL
  • Stored Procedures in MySQL
  • Common Table Expressions(CTE)
  • Window Functions in MySQL
  • Stored procedure templates using AI
  • Debug window functions with AI

Project:

Amazon - Sales Data Analysis Using SQL

As a Data Analyst at Amazon, you have been tasked with using SQL to analyze sales transactions, customer orders, product performance, regional trends, and revenue metrics. Perform complex queries, joins, aggregations, and subqueries to uncover sales patterns, identify top-performing products, evaluate customer behavior, and support data-driven business decisions.

Case Study

Icon
Swiggy Analysis Using SQL

Swiggy seeks insights from its SQL dataset. Implement sophisticated SQL queries with intricate joins for in-depth analysis and strategic decision-making.

SQL Interview Prep with Industry Expert

SQL is the backbone of data analysis. Get ready to deep dive into complex queries, optimize your understanding of database management, and leave with pro tips to stand out in SQL-based interview questions.

Milestone 3 - Duration: 3 weeks

Transform raw data into powerful insights with Data Visualization! Learn to create interactive dashboards, compelling charts, and dynamic reports using tools like Power BI and Tableau. Master the art of storytelling with data and make informed decisions with ease!

Week 7

Data Visualisation with Power BI

  • Introduction to Power BI
  • Data Connectors
  • Power Query Editor and Tools
  • Append Queries and Merge Queries
  • Pivoting and Unpivoting of data
  • Exploring datasets with AI
Week 8

Advanced-Data Modeling and DAX in Power BI

  • Data Modelling and Cardinality
  • Cross Filter Direction
  • Measures vs Calculated Columns
  • Functions in DAX
  • Cumulative Sales and Moving
  • Average Using DAX
  • AI natural language to DAX
  • AI anomaly detection for trends
  • DAX optimization using AI
  • AI quick YoY, MoM, rolling avg
Week 9

Visualisations and Dashboard Creation in Power BI

  • ChatGPT for Measures
  • Column Charts and Slicers
  • Matrix vs Tables
  • Cards, KPI and Gauge Chart
  • Formatting a Dashboard
  • AI-generated DAX & explanations
  • Smart Narratives for auto-insights

Project:

Olympic Games - Athlete Performance & Medal Analysis

As a Data Analyst for the Olympic Games, you have been tasked with using Power BI to build a comprehensive Sports Performance Dashboard. Analyze athlete profiles, country-wise participation, medal distribution, event categories, and historical trends to identify top-performing nations, emerging sports, gender participation patterns, and factors influencing medal success for strategic sports development and funding decisions.

Case Study

IconIcon
Financial Performance Analysis Using Power BI & DAX

As a Data Analyst, you have been tasked with using Power BI and DAX (Data Analysis Expressions) to build an interactive Financial Intelligence Dashboard. Develop complex measures including running totals, moving averages, Year-to-Date (YTD), Month-to-Date (MTD), Year-over-Year (YoY) growth, and variance analysis to monitor revenue and cash flow trends, enabling data-driven financial planning and strategic decision-making.

Data Storytelling Fest

Transform raw data into compelling stories using Power BI/Tableau and compete to present the best insights.

Milestone 4 - Duration: 5 weeks

Master Python for Data Analytics! From data manipulation with Pandas to visualization with Matplotlib & Seaborn, and numerical computing with NumPy, this milestone will equip you with essential coding skills to analyze, transform, and visualize data efficiently.

Week 10

Python Basics

  • Introduction to Python for Data Analytics
  • Datatypes and Variables
  • Operators in Python
  • Control Flow in Python
  • Data Structures in Python
  • AI regex for data cleaning
  • AI variations & debugging
Week 11

Python Advance

  • Functions in Python
  • In-built Modules
  • Pickle Library
  • Introduction to Numpy
  • Statistical Functions in Arrays
  • AI-assisted file handling automation
  • AI real-world dataset examples
Week 12

Python Libraries - Pandas, Matplotlib and Seaborn

  • Introduction to Pandas
  • Cleaning Data with Pandas
  • Merge, concatenate and join Pandas
  • Introduction to Matplotlib
  • Charts in Matplotlib
  • AI imputation strategies
Week 13

Introduction to AI Automation For Data Analysis

  • Why AI Automation Matters for Data Analysts
  • How LLMs Actually Work
  • The Art of Prompt Engineering
  • Overview of AI Automation Tools
  • AI-Assisted Data Cleaning and Preprocessing
  • AI for Automated EDA
Week 14

AI Automation and Workflow

  • How LLMs Actually Work
  • The Art of Prompt Engineering
  • RAGs, Fine Tuning & Model Optimization
  • AI-Powered Workflow Automation
  • Set up smart checks and alerts
  • Generate insights with AI-driven flows

Project:

Apollo - Appointment No-Show & Patient Engagement Analysis

As a Data Analyst at Apollo, you have been tasked with using Python to do a comprehensive Healthcare Utilization Analysis. Analyze patient booking patterns, no-show rates, time-slot performance, reminder effectiveness, consultation pricing, and visit history to identify key predictors of missed appointments, evaluate intervention strategies, and improve doctor utilization, patient outcomes, and platform trust.

Unilever Multi-Layer Workflow Automation

You are a data analyst at Unilever tasked with developing a multi-layer workflow automation system. The goal is to create a simple yet efficient automated pipeline that handles raw data, performs basic preprocessing, generates insightful visual dashboards, and shares the final reports without any manual intervention.

Case Study

Icon
Amazon Prime Video - Content Performance & Viewer Retention Analysis

As a Data Analyst at Amazon Prime Video, you have been tasked with using Python to analyze viewing completion rates, genre preferences, release timing, audience engagement, and marketing spend to identify success patterns, and support data-driven decisions for future content investments.

Python Hackathon

Compete to solve coding challenges in the shortest and most efficient way possible while learning best practices.

Milestone 5 - Duration: 4 weeks

A 4-week immersive internship where you work as a Data Analyst Intern at WsCube Tech on real business challenges. Gain hands-on experience in data analysis, visualization, and reporting across multiple departments. Experience the real workflows of modern data teams while contributing to decision-driving projects.

Week 1

Data Organization & Foundation

  • Work with real business data from day one
  • Organize and structure data for business use
  • Build solutions that improve team efficiency
  • Understand how data flows within an organization
Week 2

Data Discovery & Reporting

  • Extract meaningful information from company data sources
  • Identify trends, patterns, and inconsistencies
  • Perform structured analysis on business datasets
  • Prepare concise reports for team leads and stakeholders
Week 3

Visualization & Dashboarding

  • Build interactive dashboards for real business teams
  • Transform findings into clear visual outputs
  • Design for non-technical audiences
  • Ensure accuracy, clarity, and business relevance
Week 4

Insights & Stakeholder Presentation

  • Consolidate work from all previous weeks
  • Craft a data-driven business narrative
  • Present findings to WS Cube Tech stakeholders
  • Demonstrate analytical thinking and communication skills
Bonus

Learn the latest tools and trends shaping the future of data roles.

Maths & Applied Statistics

  • Introduction to Statistics
  • Descriptive Statistics
  • Hypothesis Testing
  • AB Testing
  • Fundamentals of Probability
  • AI sample test scenarios
  • AI-driven simulations for visualization

Machine Learning

  • What is ML?
  • Applications of Machine Learning
  • Linear Regression
  • Decision Trees
  • Random Forests and Ensemble Methods
  • AI auto-generated regression datasets
  • AI-assisted debugging & result interpretation

Microsoft Fabric

  • Unified analytics with Microsoft Fabric ecosystem.
  • Integrate Power BI, Lakehouse, and Data Factory seamlessly.
  • Master modern Fabric architecture and Dataflow Gen2.
  • Build and manage Lakehouse with Delta Tables.
  • Execute a real-world Fabric project end to end.
  • Migrate legacy dashboards to Fabric effortlessly.
  • Automate pipelines and data refresh workflows.
  • Enable real-time insights with Power BI + Fabric.

Database Design & Architecture (MySQL)

  • Introduction to Database Design
  • Understanding Data Models (Conceptual, Logical, Physical)
  • Entity-Relationship (ER) Diagrams Basics
  • Normalization & Denormalization Concepts
  • Primary Keys, Foreign Keys & Relationships
  • Designing a Simple Database Schema in MySQL

Google Analytics 4 (GA4) for Data Analysts

  • Introduction to Google Analytics 4
  • Setting Up GA4 Property and Data Streams
  • Understanding Events, Parameters, and User Data
  • Exploring Reports and Key Metrics (Engagement, Retention, Traffic)
  • Connecting GA4 with BigQuery and Power BI
  • Building Dashboards and Interpreting Insights

Last Mile 3-Stage Exclusive Preparation

Your final sprint to becoming a top 1% data analyst.

Last Mile 3-Stage Exclusive Preparation

Your final sprint to becoming a top 1% data analyst.

01

Gear Up

Build a strong online presence with to get noticed by recruiters.

02

Pitch Perfect

Learn to present insights confidently and crack HR & technical rounds.

03

Tech Skill Setup

Get ready for technical rounds with real-world challenges.

01

Gear Up

Build a strong online presence with to get noticed by recruiters.

Gear Up
Gear Up

Resume Building

Craft impactful, job-ready resumes.

Portfolio

Showcase your projects and data stories effectively.

GitHub

Present real work with structured repositories.

LinkedIn

Optimize your profile for recruiter visibility.

02

Pitch Perfect

Learn to present insights confidently and crack HR & technical rounds.

Pitch Perfect
Pitch Perfect

The Art of Storytelling

Present your analytics projects with clarity, context, and impact.

Talent Expectations

Learn how to align your pitch with what top recruiters look for.

Interview Tactics

Build authentic and structured responses for behavioral rounds.

Communication Mastery

Develop speaking and body language skills for interviews.

03

Tech Skill Setup

Get ready for technical rounds with real-world challenges.

Tech Skill Setup
Tech Skill Setup

Technical Round Prep

Problem-solving with SQL, Excel, Python & BI-based questions.

Assessments

Tackle assignments & case studies-specific data problems.

Whiteboarding Challenges

Practice structured thinking and data storytelling on the spot.

Guesstimates Practice

Crack analytical estimation and business reasonings confidently.

certificat-icon

Industry-Recognized Certificate

Earn a data analytics certification valued by employers.

certificat-icon

Stand Out in the Job Market

Build credibility with hands-on experience and certification.

certificat-icon

Your Gateway to Analytics Careers

Access roles across analytics, business intelligence, and data teams.

certificat-icon

Industry-Recognized Certificate

Earn a data analytics certification valued by employers.

certificat-icon

Stand Out in the Job Market

Build credibility with hands-on experience and certification.

certificat-icon

Your Gateway to Analytics Careers

Access roles across analytics, business intelligence, and data teams.

Data Events

Hackathons, Caseathons & Jam Sessions

Collaborate in live “data war rooms” and solve business challenges using AI tools, dashboards & decision frameworks like real analysts.

5+

Jam Sessions

12+

Live Challenges

Turn theory into action faster than any traditional course.

Hackathon event
Proof of Work

Build a Career-Ready Analyst Portfolio

Build real dashboards, automate workflows & host your own public portfolio website to showcase to recruiters instantly.

6+

Major Industry Projects

Icon

Public Portfolio & GitHub Proof

You won’t need to 'tell' - your work will 'prove'.

Portfolio creation session
Analytics & AI Tools

Train on the Exact Tools Used in Top Companies

Hands-on mastery of Excel, SQL, Power BI, Python & AI copilots, the real enterprise workflow stack used by data teams today.

16+

Data & AI Tools

100%

Job-Relevant Stack

No outdated theory, pure real-world execution.

Students using real tools
Doubt Solving & Community Support

Learn with a Powerful Peer Circle & Mentor Network

Instant doubt solving, peer learning circles & career accountability - never stuck, always supported, always ahead.

1.5 Lakh+

Data Geeks Community

Icon

Live Mentor Access

You’re never learning alone - ever.

Group discussion with mentors
Mock Interviews

Perfect your skills with Mock Interview Sessions

Crack recruiter expectations with 1:1 mock interviews, project defense rounds & data storytelling challenges - designed exactly like real hiring.

Icon

Tech Round

Icon

HR Round

Walk into interviews with absolute confidence.

Mock interview happening
Graduation Ceremony

Grand Celebration of Graduation & Certification Ceremony

Graduate with pride in a formal offline ceremony, receive your certification, and showcase your final projects to mentors, recruiters & alumni.

Icon

Top Performer Showcase

Icon

WsCube Tech Certification

You don’t just complete - you get celebrated & noticed.

Upskilled students with certificates
Mentore

Kushagra Bhatia

Founder

WsCube Tech
Mentore

Pradeep Rai

Sr. Web Mentor at

WsCube Tech
Mentore

Ayushi Jain

(Lead Data Analyst, WsCube Tech) at

WsCube Tech
Mentore

Bhawani Singh

Data Analyst Trainer at

WsCube Tech
Mentore

Kushagra Bhatia

Founder

WsCube Tech

See what learners are saying

What Previous Batch Learners Are Saying!

Anshika
Anshika
Play video
Anshika
Sujal
Sujal
Play video
Sujal
Muskan
Muskan
Play video
Muskan
Lilima
Lilima
Play video
Lilima
Icon

Siddharth Rathore

Icon
Icon

Ritu Choudhary

Icon
Data analytics is the process of examining large data sets to identify trends, patterns, and insights that can be used to inform business decisions.
There are no prerequisites to attend our data analysis course in Jodhpur. Any fresher, college learner, freelancer, or working professional can sign up for the course.
learners need 3 months to complete the entire course, including attending classes, submitting assignments, and giving tests.

Data analytics is a lucrative field, with many job and learning opportunities. Many companies- big and small, are looking for skilled data analysts to handle their projects and are ready to pay attractive salary packages to deserving candidates.

According to a recent survey, the demand for data analysts in India has increased by 400% in the past few years against the 19% increase in supply.

Moreover, data analytics training helps you acquire a range of problem-solving and analytical skills that can be used to draw meaningful insights and analyse huge amounts of data.

The starting salary package for a fresher can be around 6-8 LPA, provided you are working in a major city, such as Delhi, Mumbai, or Bangalore. An experienced data analyst with 5+ years of experience can land a job with a handsome salary package of 25+ LPA.

Any interested candidate can apply for our data analytics course in Jodhpur. Along with IT professionals, many non-IT professionals from the banking, marketing, and sales sectors are a part of our learners’ community.

This course is ideal for freshers but experienced learners who are working as project managers, BI professionals, information architects, software developers, and data analysts can also apply for the course.

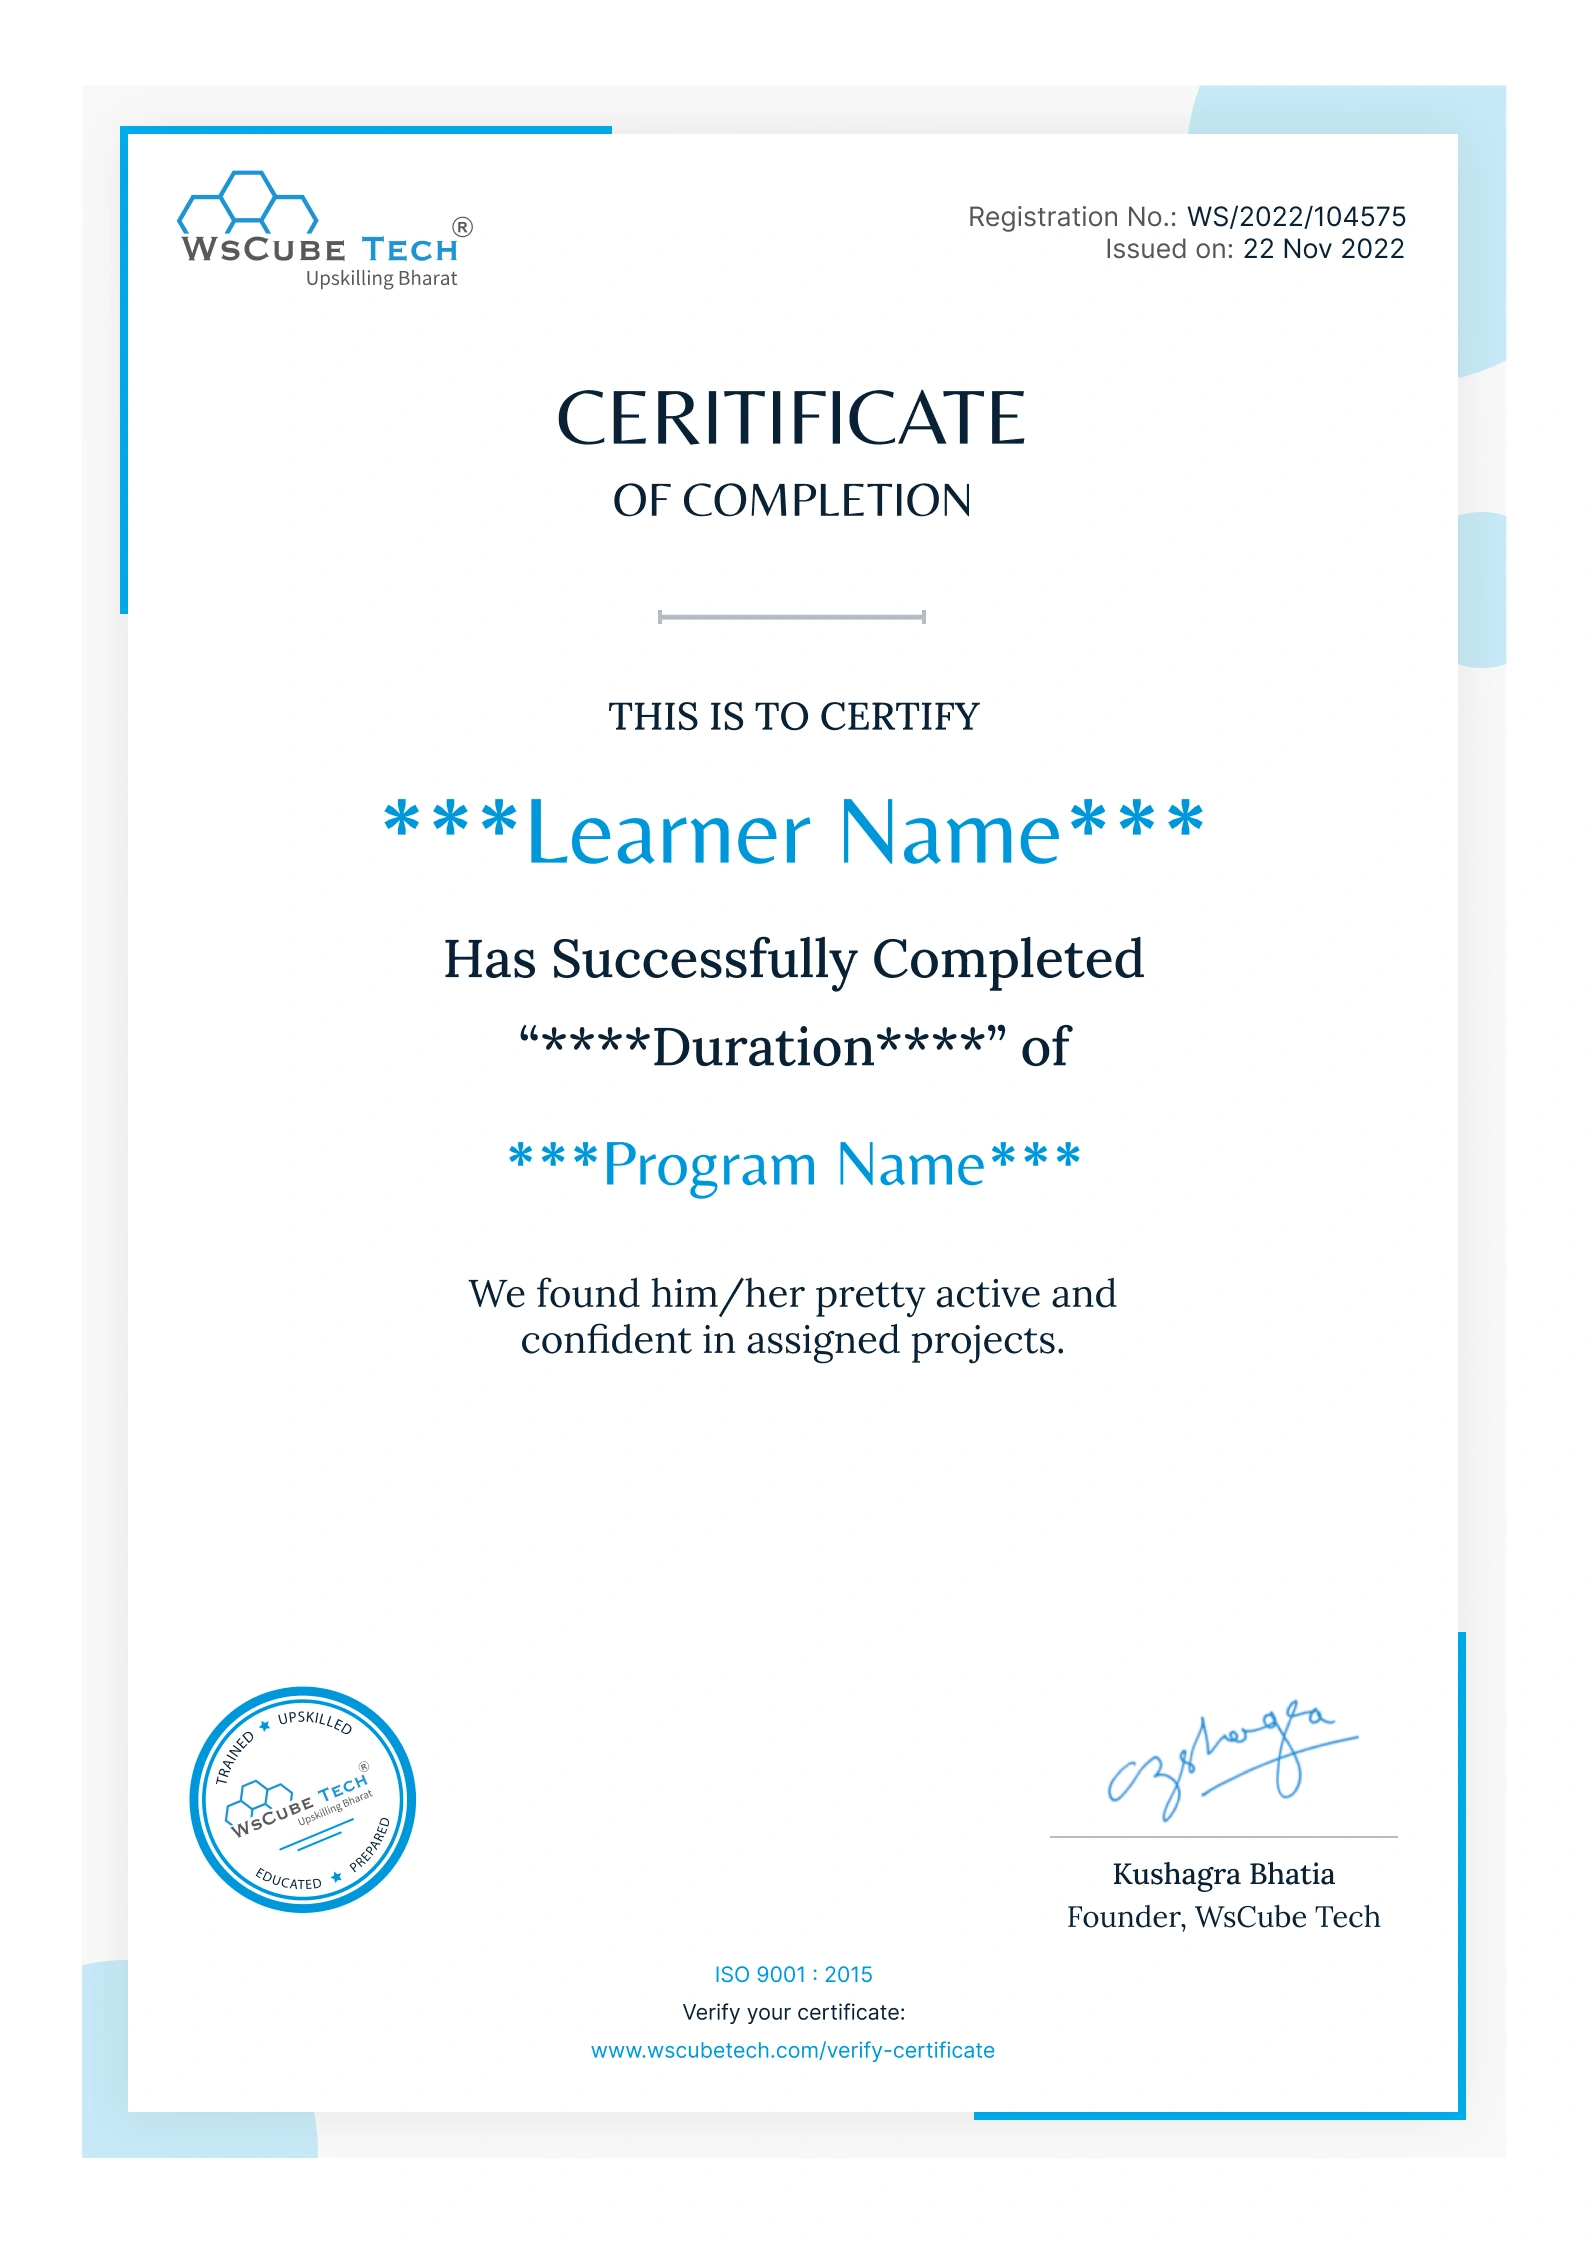
WsCube Tech offers a data analytics certification course where you receive a professional certificate after completing the training. Add this certificate to your resume to validate your capabilities as a data analyst. Also, it will help you explore better opportunities and boost your career.
Yes. Upon completing the course and submitting all the assignments, feel free to get in touch with our job assistance team. Our experts will help you build a strong resume and find a job based on your expertise and interest.

Our data analytics course in Jodhpur covers:

  • Python Programming
  • Data analysis
  • Data visualization
  • Power BI
  • Data modelling
  • AI visuals
  • SQL
  • Advanced Excel
A data analytics course can prepare you for roles such as data analyst, business intelligence analyst, data scientist, and data engineer.
Yes, our data analytics courses is designed in a way to to accommodate learners of all levels. So beginners can join it.

Best Data Analytics Course in Jodhpur

Jodhpur is rapidly emerging as one of Rajasthan's growing destinations for technology education, startups, and digital careers. As businesses increasingly rely on data to drive decisions, the demand for skilled Data Analysts continues to rise across industries. Enrolling in a Data Analytics Course in Jodhpur can help you build future-ready skills while staying close to home.

One of the biggest advantages of learning in Jodhpur is access to quality education without the high living costs associated with metro cities. At the same time, learners can benefit from growing career opportunities across IT, eCommerce, finance, healthcare, education, and consulting sectors.

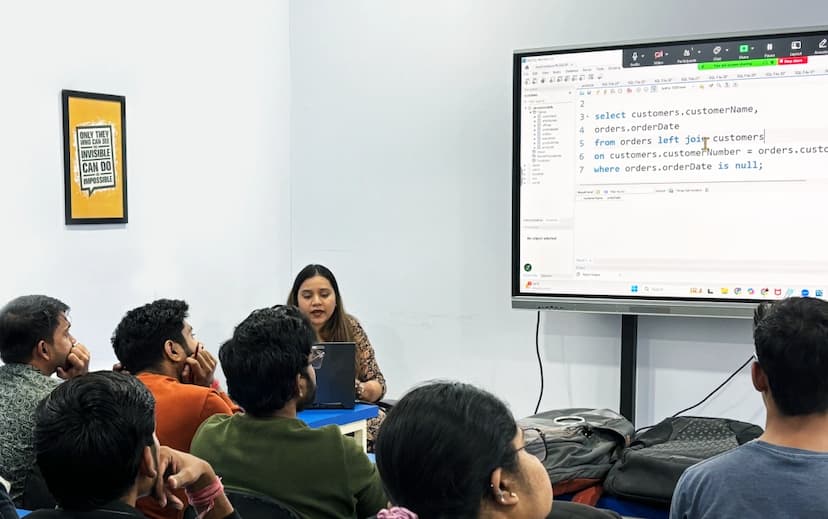
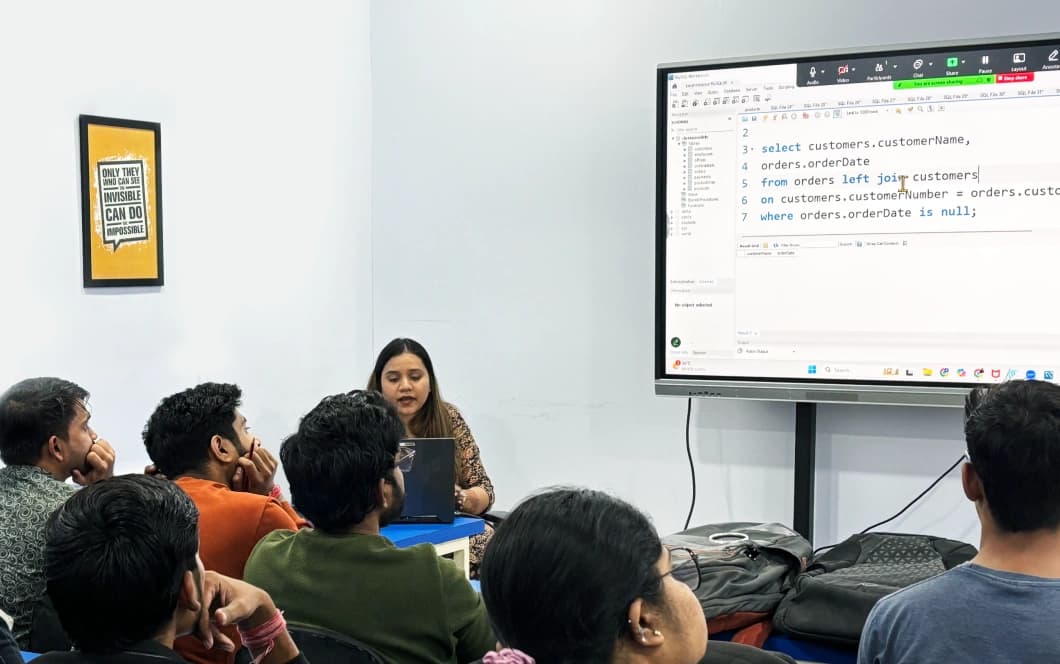
At WsCube Tech's Data Analytics Institute in Ratanada, Jodhpur, students gain practical exposure through real-world datasets, business case studies, dashboards, and industry projects. Our focus is not just on learning tools but on developing analytical thinking and problem-solving skills that employers actively seek.

Additionally, Jodhpur's growing business ecosystem and strong connectivity with major cities create exciting career opportunities for aspiring analytics professionals.

Why Choose WsCube Tech for Data Analytics Course in Jodhpur?

If you're looking to build a successful career in analytics, choosing the right Data Analytics Institute in Jodhpur is essential. WsCube Tech's training program is designed to help learners become industry-ready through practical learning, expert mentorship, and career-focused guidance.

Industry-Relevant Tools: Learn the most in-demand analytics tools including Excel, SQL, Python, Power BI, Tableau, and GenAI-powered analytics tools used by modern organizations.

Hands-on Learning: Gain practical experience by working on business case studies, dashboards, data visualization projects, and real-world datasets that mirror industry challenges.

Expert Mentorship: Learn directly from experienced Data Analysts and industry professionals who provide practical insights, project guidance, and career advice.

Placement-Focused Approach: Get end-to-end career support including resume building, portfolio development, mock interviews, LinkedIn optimization, and placement assistance.

If you're searching for a Data Analytics Course in Jodhpur with Placement Assistance, this program offers the right combination of technical skills, practical exposure, and career support.

Who Can Join Our Data Analytics Classes in Jodhpur?

Our Data Analytics Course in Jodhpur is designed for learners from diverse academic and professional backgrounds. Whether you're starting fresh or planning a career transition, the program is structured to support your growth.

Fresh Graduates: Graduates from engineering, commerce, science, management, arts, and other disciplines can build a strong foundation in analytics and start a rewarding career.

Working Professionals: Professionals looking to switch careers or strengthen their analytical skills can benefit from flexible learning options and practical training.

Business Owners: Entrepreneurs can learn how to use data to improve decision-making, optimize operations, and identify growth opportunities.

Career Changers: Individuals from non-technical backgrounds can confidently enter the analytics field through our beginner-friendly learning approach.

Whether you're from Ratanada, Sardarpura, Paota, Shastri Nagar, Bhaskar Circle, or nearby areas, our Data Analytics Institute in Jodhpur provides the right environment to learn and grow.

Data Analytics Career Scope in Jodhpur

Data analytics is becoming one of the most sought-after career paths as organizations increasingly rely on data-driven decision-making. Businesses today need professionals who can collect, analyze, visualize, and interpret data to solve complex business problems.

In Jodhpur, opportunities are growing across sectors such as IT services, healthcare, education, manufacturing, finance, retail, tourism, and eCommerce. Companies are actively hiring professionals with expertise in analytics, reporting, business intelligence, and data visualization.

Entry-level Data Analysts can begin with competitive salary packages, while experienced professionals can progress into roles such as Business Analyst, BI Analyst, Analytics Consultant, Data Scientist, and Analytics Manager.

Beyond traditional employment, data analytics also opens doors to freelancing, consulting, remote opportunities, and entrepreneurial ventures. With the right skills and portfolio, professionals can work with clients and organizations across India and globally.

About Our Data Analytics Institute in Jodhpur

WsCube Tech is one of the leading destinations for Data Analytics Training in Jodhpur, helping learners transform their careers through practical, industry-focused education.

Located at Ratanada, Jodhpur, our institute offers a modern learning environment where students gain hands-on experience with industry tools, business projects, and real-world analytics workflows.

Our curriculum is regularly updated to align with industry trends, ensuring learners stay ahead in a rapidly evolving analytics landscape. Every concept is taught through practical application, helping students develop confidence and job-ready skills.

Beyond training, we provide placement assistance, portfolio development support, mock interviews, and direct industry exposure to help learners successfully transition into analytics careers.

How to Reach WsCube Tech – Data Analytics Training Center in Jodhpur

Our Data Analytics Training Center is conveniently located in Ratanada, Jodhpur, making it easily accessible from Sardarpura, Paota, Shastri Nagar, Bhaskar Circle, Residency Road, and nearby locations.

Students can reach the center through public transport, cabs, auto-rickshaws, or personal vehicles. The location offers excellent connectivity and a comfortable learning environment for daily classes.

We encourage prospective learners to visit the campus, interact with mentors, and explore the facilities before enrolling. You can also schedule a free counseling session to understand the curriculum, career opportunities, and placement support available through the program.

For learners who cannot visit immediately, our team also provides online counseling and career guidance sessions.

Tools You Will Learn in Our Data Analytics Course in Jodhpur

Our curriculum covers the most widely used analytics tools and technologies that employers actively look for.

Excel: Learn advanced formulas, dashboards, pivot tables, automation, and data analysis techniques.

SQL: Master database querying, data extraction, joins, aggregations, and reporting techniques.

Python: Analyze data using Python and popular libraries such as Pandas, NumPy, and Matplotlib.

Power BI: Build interactive dashboards and business intelligence reports for data-driven decision-making.

Tableau: Create powerful visualizations and communicate insights through impactful dashboards.

GenAI Tools: Leverage AI-powered tools to automate reporting, generate insights, and improve productivity.

In addition, you'll develop skills in data cleaning, exploratory analysis, visualization, business intelligence, and analytics workflows.

Industries Hiring Data Analysts in Jodhpur

Data analytics skills are valuable across almost every industry today.

IT & Software Services: Companies use analytics to improve products, user experiences, and business performance.

eCommerce & Retail: Organizations rely on analytics for customer insights, demand forecasting, and sales optimization.

Banking & Finance: Financial institutions use data for risk assessment, fraud detection, and customer analytics.

Healthcare: Healthcare providers leverage analytics to improve patient outcomes and operational efficiency.

Manufacturing: Manufacturers use data to optimize production processes and improve quality control.

Education & EdTech: Educational organizations use analytics to improve learning outcomes and business performance.

Tourism & Hospitality: Hotels, travel businesses, and hospitality brands use analytics to understand customers and improve services.

This diversity creates multiple career opportunities for learners after completing their Data Analytics Course in Jodhpur.

Online vs Offline Data Analytics Course in Jodhpur

Choosing between online and offline learning depends on your schedule, preferences, and learning style.

Offline classroom training provides face-to-face mentorship, immediate doubt resolution, peer learning, and a structured environment that helps learners stay consistent.

Online learning offers flexibility, recorded sessions, and the convenience of learning from anywhere while balancing work or other commitments.

Both learning formats cover the same curriculum, projects, and career support. Regardless of your chosen mode, you receive industry-relevant training, project experience, and placement assistance.

Job Opportunities After a Data Analytics Course in Jodhpur

Completing a Data Analytics Course in Jodhpur can open doors to a wide range of high-growth career opportunities.

Entry-Level Roles

  • Data Analyst
  • Junior Data Analyst
  • MIS Executive
  • Reporting Analyst

Mid-Level Roles

  • Business Analyst
  • BI Analyst
  • Analytics Consultant
  • Power BI Developer

Advanced Roles

  • Analytics Manager
  • Data Scientist
  • Business Intelligence Lead
  • Data Strategy Consultant

Our placement support includes resume building, portfolio development, mock interviews, and direct hiring assistance to help learners confidently enter the job market.

Whether you aim to secure a full-time role, work remotely, freelance, or build your own consulting practice, the skills gained through our Data Analytics Course in Jodhpur can help you achieve your career goals.